Performance
json-as is built for multi-GB/s throughput. The generated code is monomorphized per type (no runtime schema walk), scanning is vectorized, and the hot paths avoid allocation. This page covers the knobs that matter.
Per-payload performance
Throughput across the standard payload suite (NAIVE / SWAR / SIMD vs built-in JS JSON). Higher is better.
Serialize:

Deserialize:

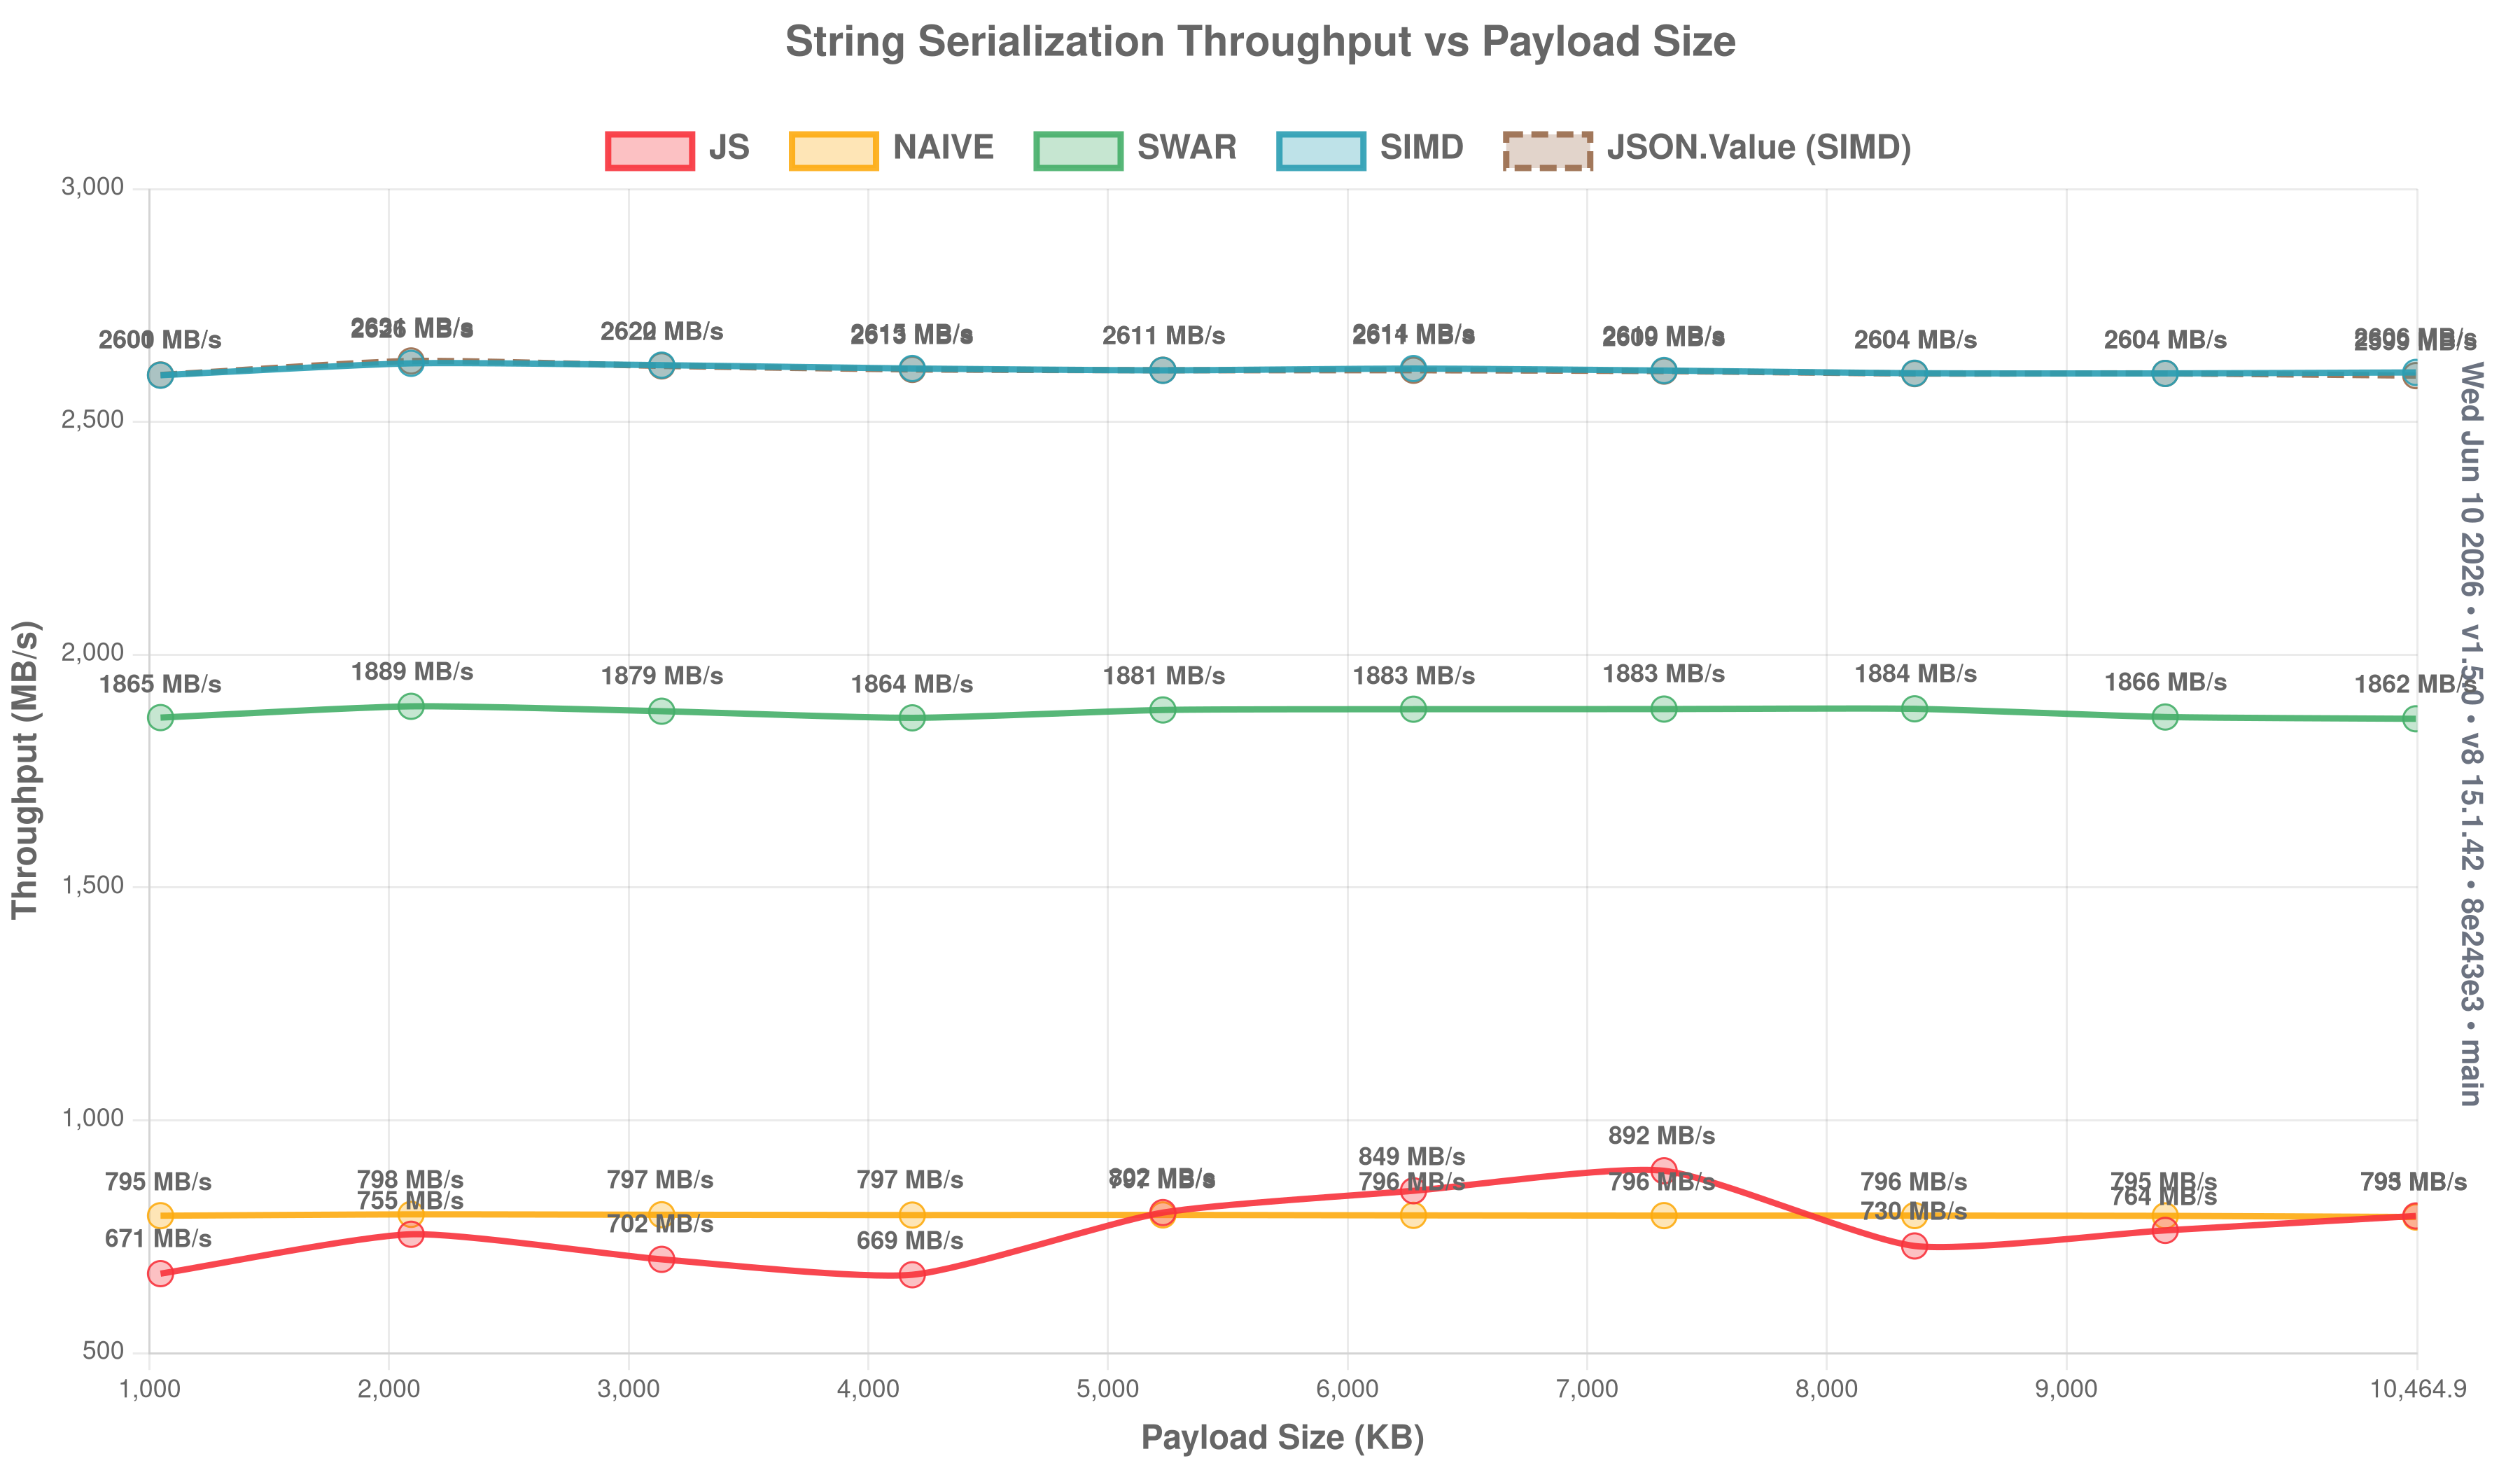
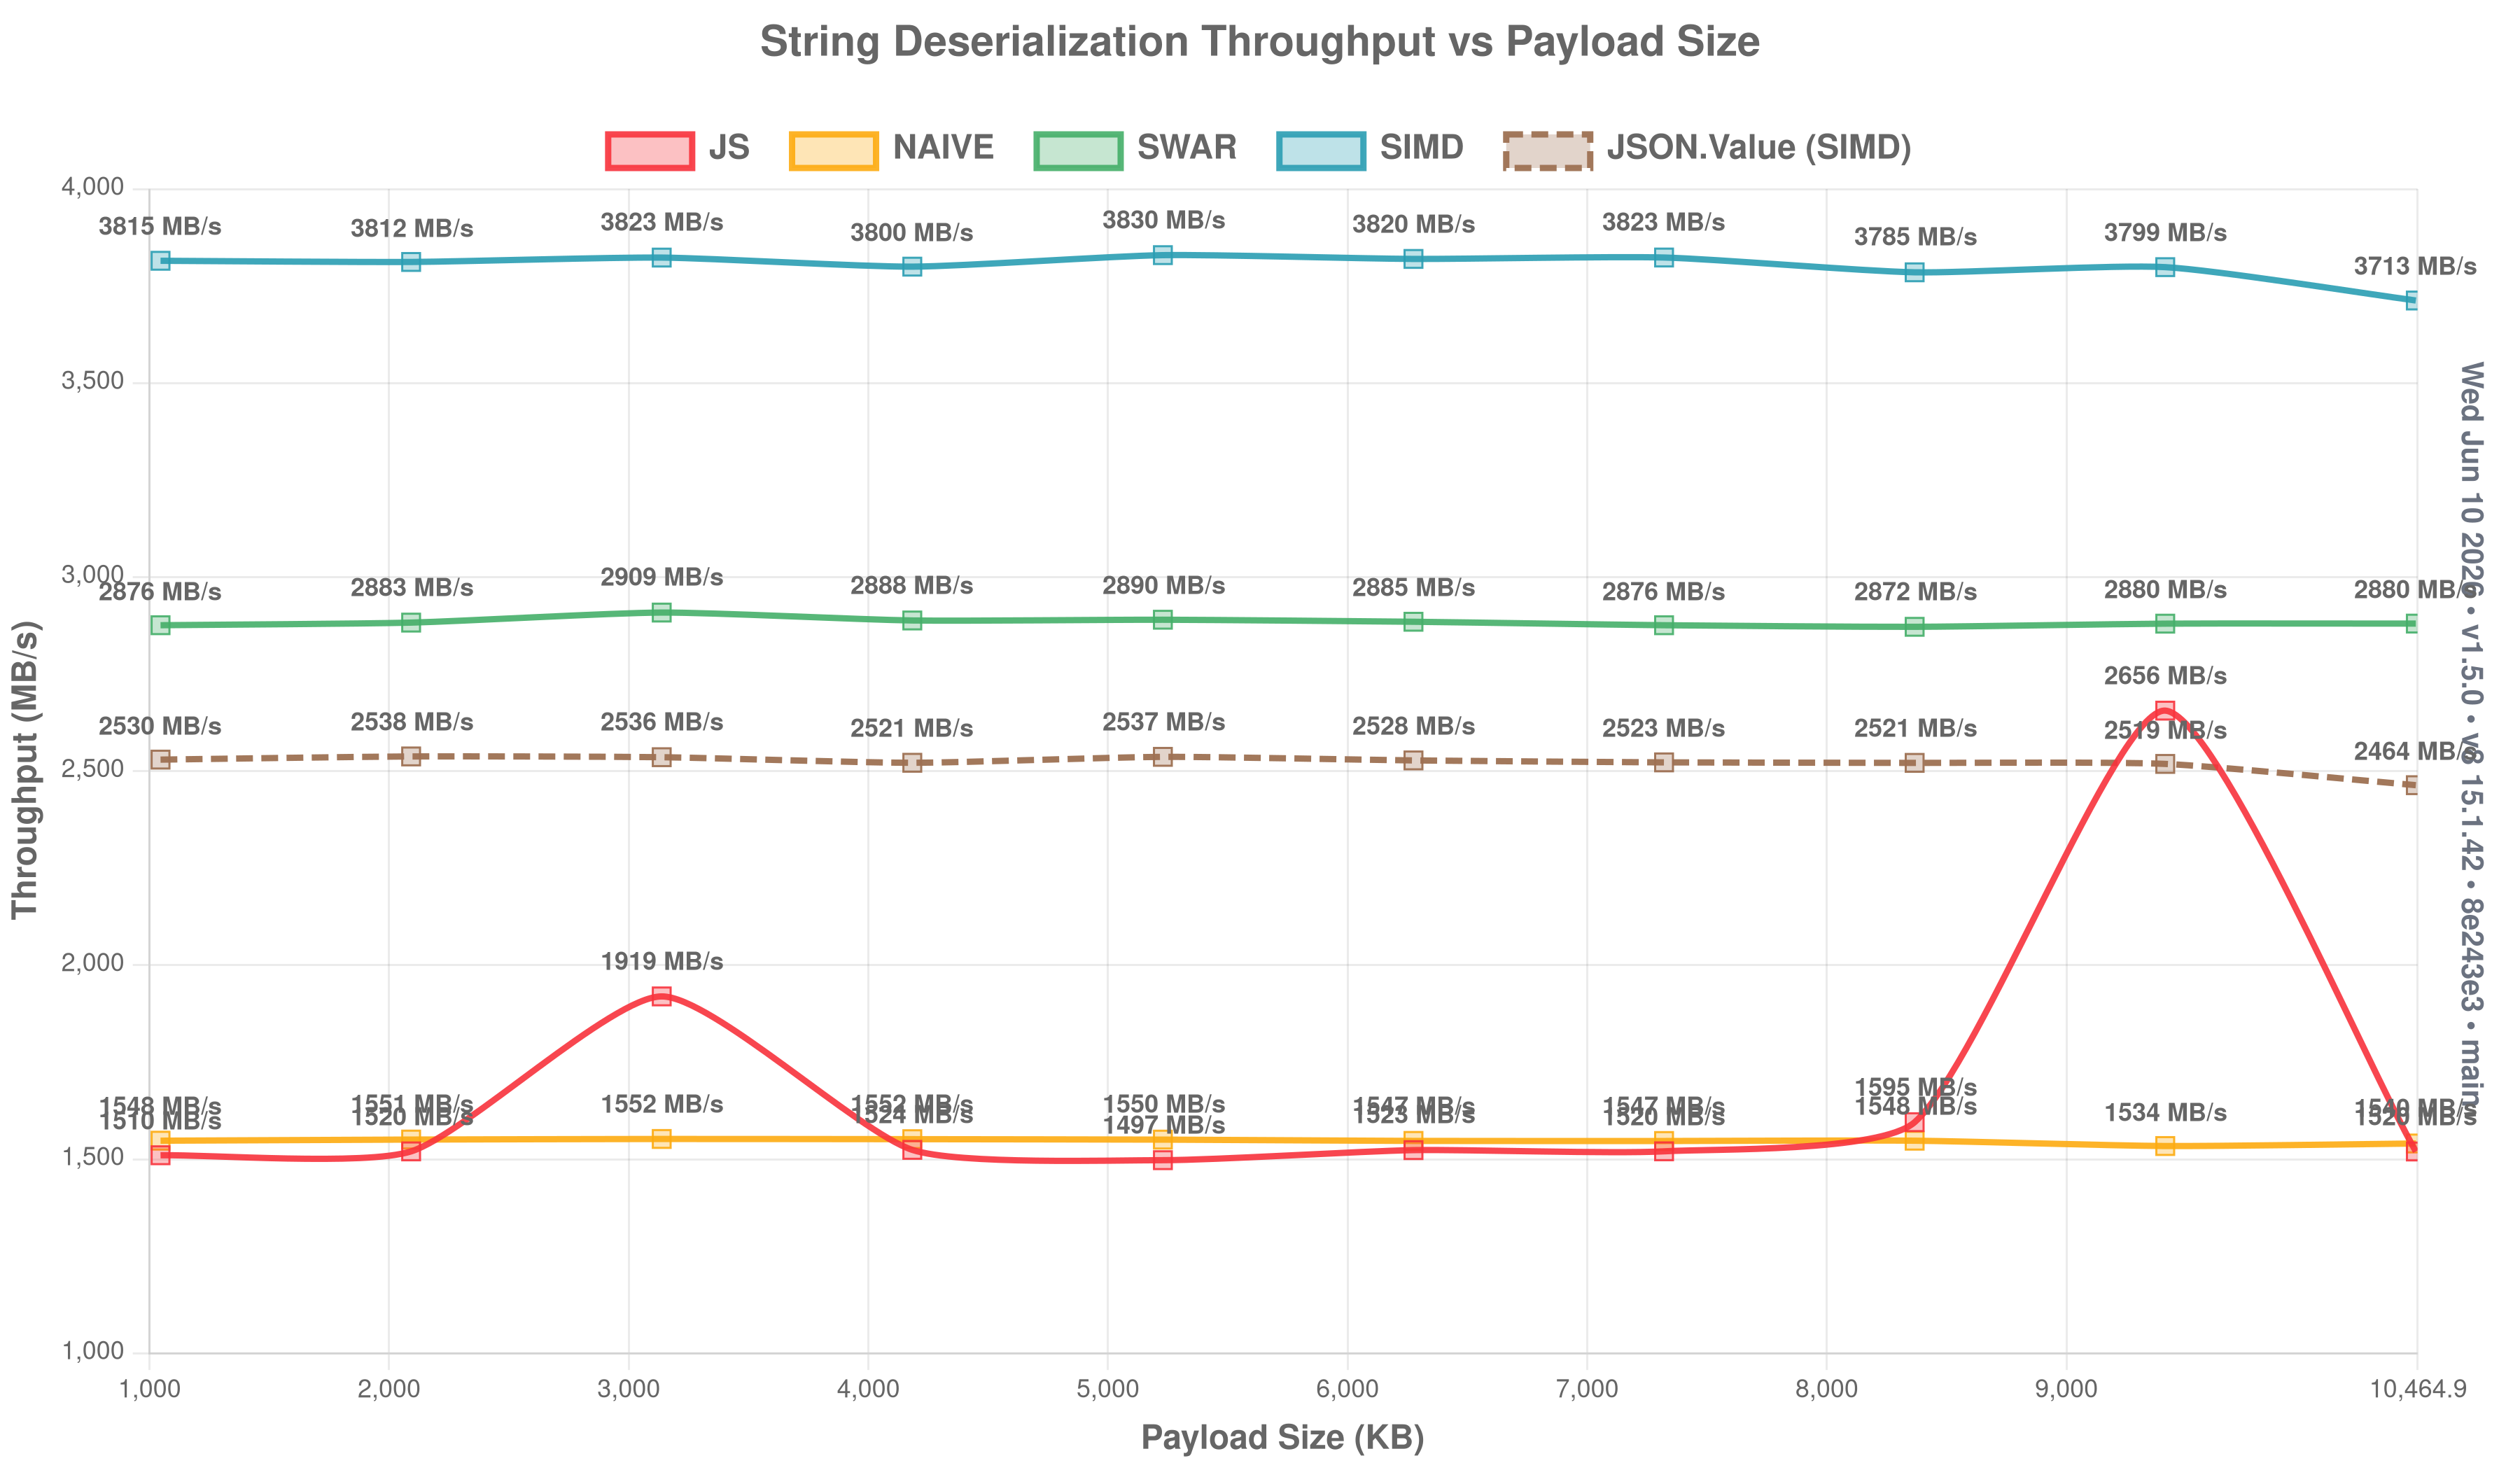
String throughput vs payload size
How throughput scales as string payloads grow from 1 KB to 1 MB. Higher is better.
Serialize:
Deserialize:
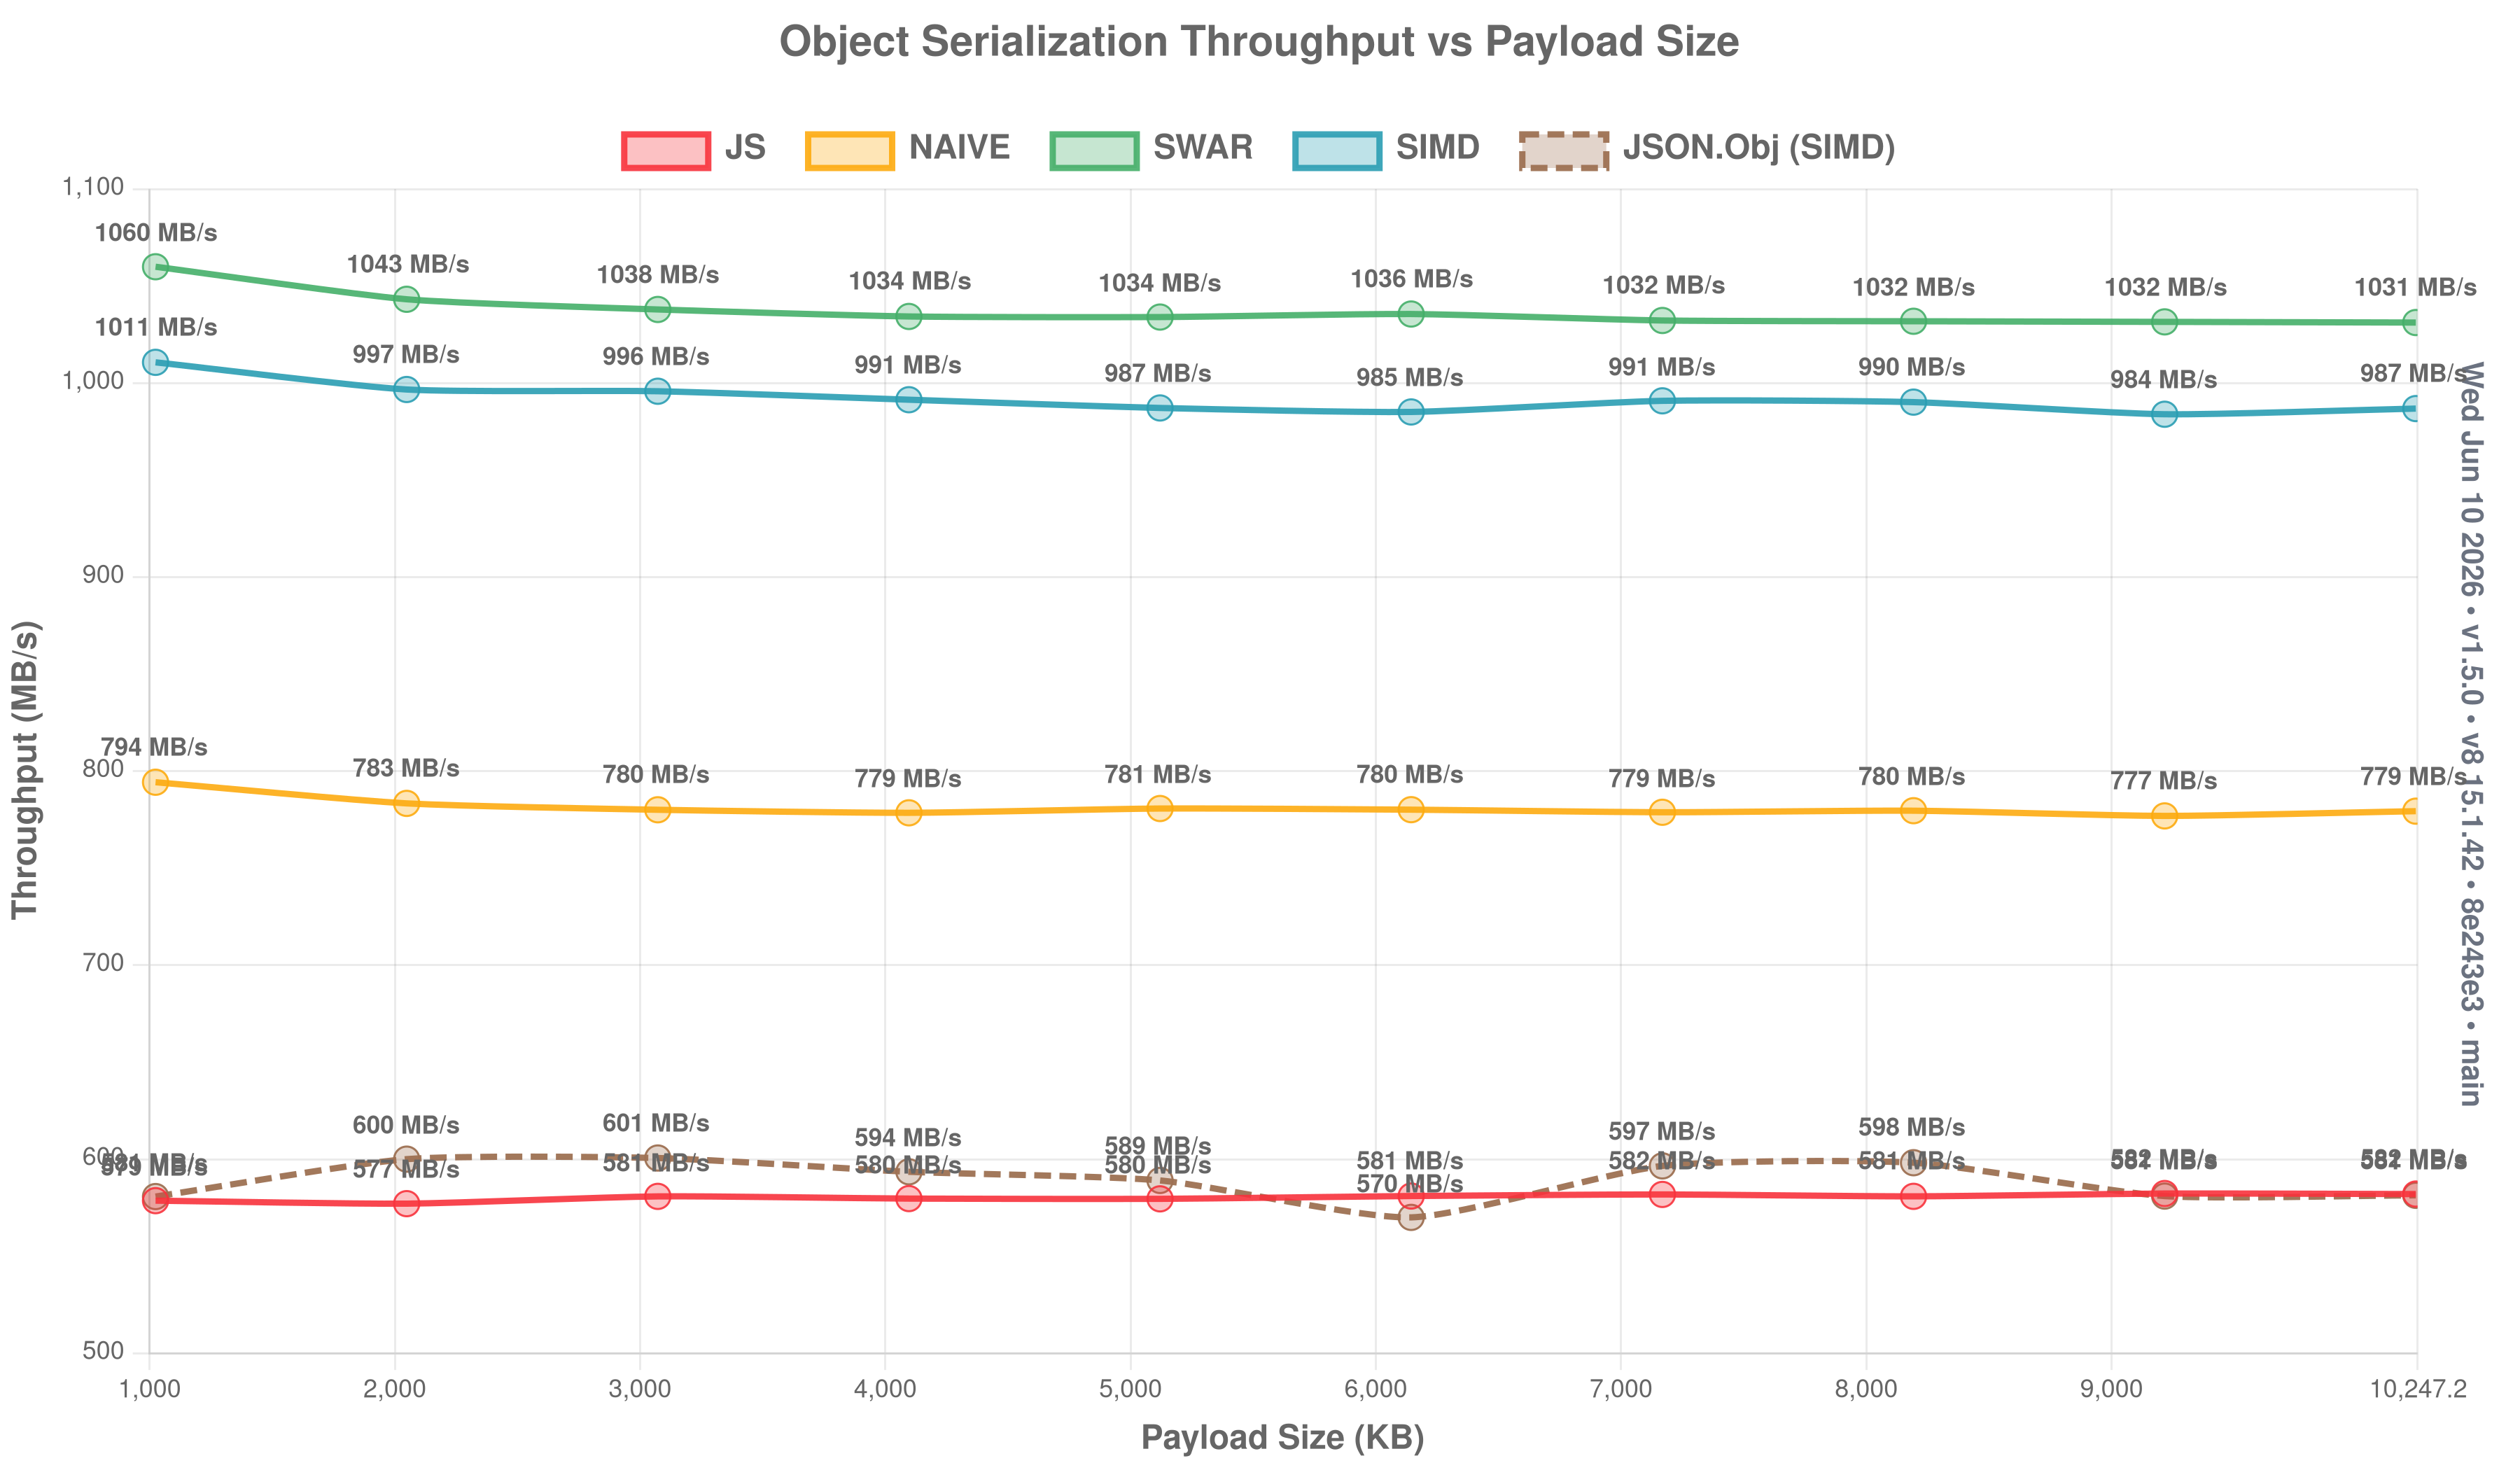
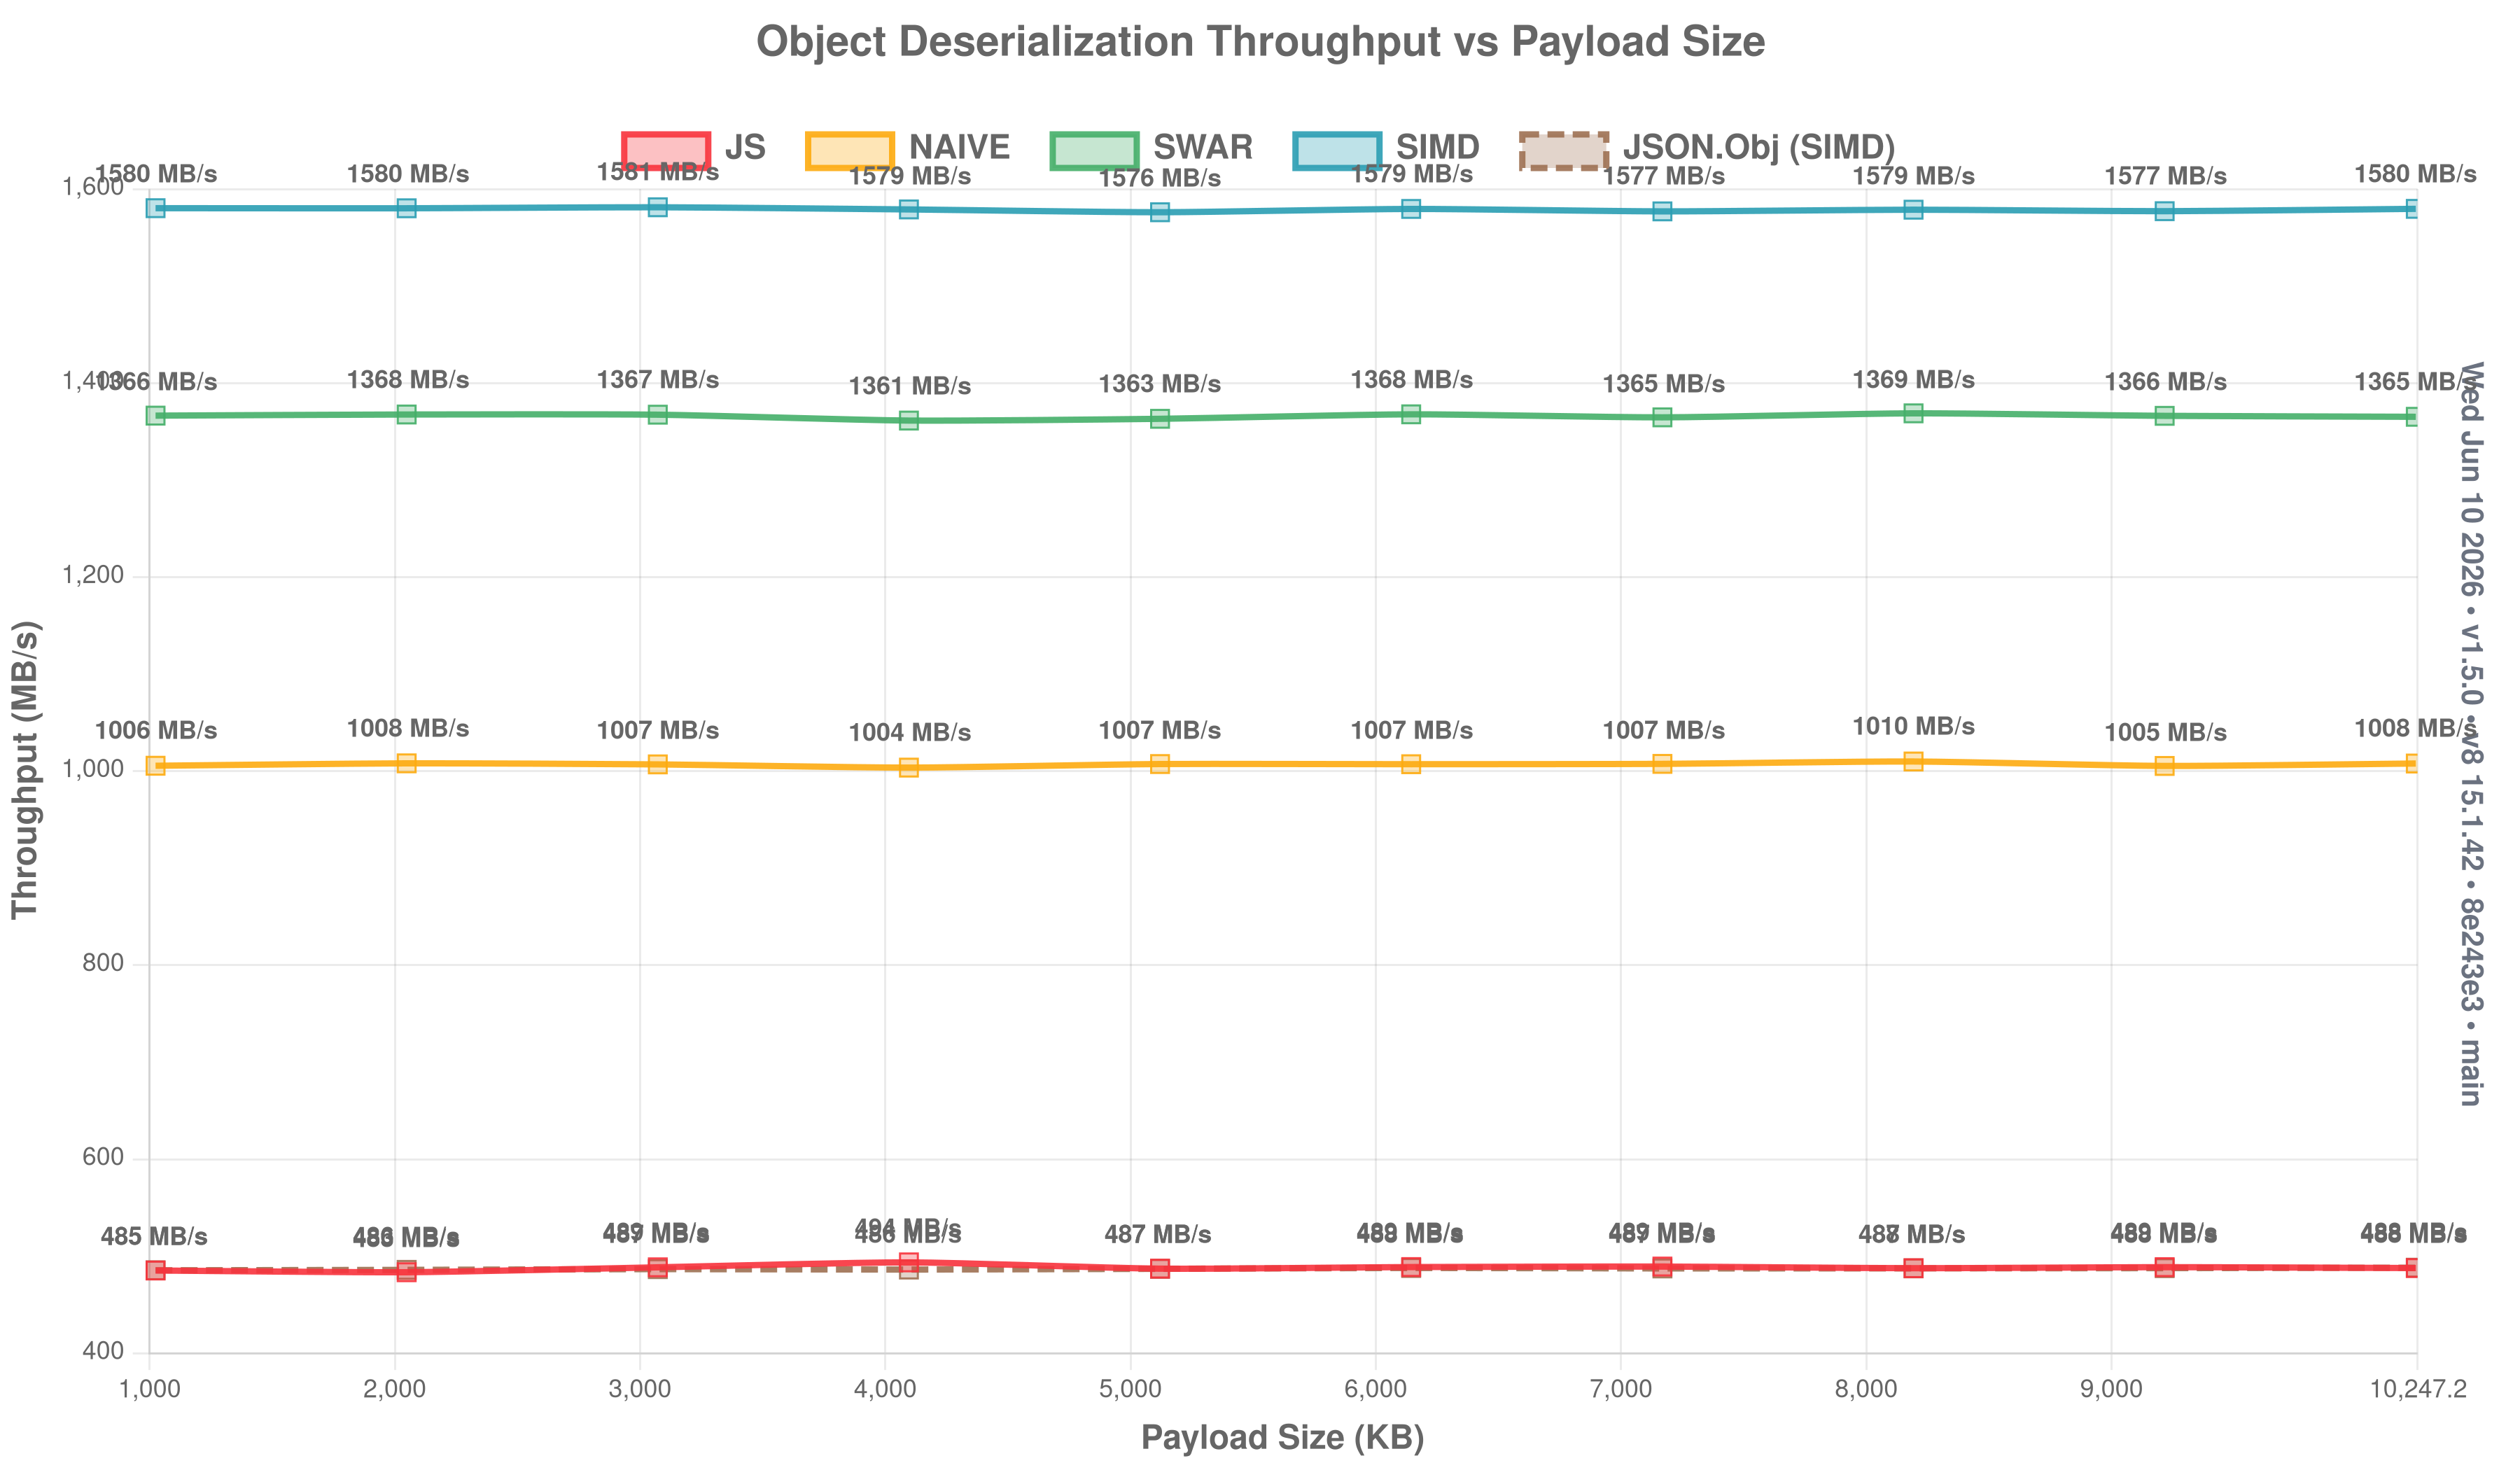
Object throughput (click to expand)
Primitive (de)serialization (click to expand)
Single-value throughput for the primitive types:


A multi-library comparison (json-as vs native JSON, fast-json, and assemblyscript-json) lives in the repository README.
Scanning modes
Pick a backend at build time with JSON_MODE (see Configuration). All three are bit-for-bit equivalent — they trade speed for code size:
| Mode | Scanning | Notes |
|---|---|---|
SWAR (default) | word-at-a-time | fast, no flags |
SIMD | 128-bit vectors | fastest on larger payloads; needs --enable simd |
NAIVE | byte-at-a-time | smallest code, slowest |
JSON_MODE=SIMD asc assembly/index.ts --transform json-as --enable simdThe fast path
For each struct the transform emits an unrolled, packed-key-template fast path that matches minified input directly, with a whitespace-tolerant tier and a general slow path as fallbacks. It's on by default; disable it with JSON_USE_FAST_PATH=0 for smaller code when parse speed isn't critical. Pretty-printed (whitespace-heavy) input stays on a fast tier rather than collapsing to the slow scanner.
Reusing objects and buffers
JSON.parse and JSON.stringify both take an optional second argument to reuse an existing object graph / output string instead of allocating fresh (see Basic Usage). In a steady-state loop over the same shape this reuses nested structs, arrays, and strings in place — effectively zero allocation after the first call.
import { JSON } from "json-as";

@json
class Vec3 {
  x: f64 = 0;
  y: f64 = 0;
  z: f64 = 0;
}

const v = new Vec3();
for (let i = 0; i < 1000; i++) {
  JSON.parse<Vec3>('{"x":1,"y":2,"z":3}', v); // fills `v`, no new allocation
}
Lazy fields
Deferring fields with @lazy / JSON.Lazy<T> / @json({ lazy }) skips parsing the fields you don't read — the win grows with payload size, and round-tripping an untouched object just forwards its raw bytes.
Deserialize — parse into the struct without reading the deferred fields:

Round-trip (parse → stringify) of an untouched object — the proxy / filter / forward case never parses or re-serializes the deferred fields:

Serialize — re-emitting a parsed object forwards the untouched fields' raw bytes instead of rebuilding them:

Access patterns — skipping, reading one field, or forwarding is far faster than eager; reading every deferred field costs a little more, since the work is deferred, not removed:

Running the benchmarks
The benchmarks live in the json-as repo. From a checkout:
bun run bench:as medium --mode simd
bun run bench:as medium --mode swar
bun run bench                       # full suite + charts
A multi-library comparison (json-as vs native JSON, fast-json, and assemblyscript-json) and the per-payload JS comparison charts are published in the repository's README.
What the numbers include
Published figures reflect end-to-end work — allocating the destination object/array before deserializing into it, building the output string, and so on. Raw parser throughput is higher than the published numbers because these intentionally include that allocation/setup cost.